markdown | last strategy#
In this page, both the code and the markdown cells have images. The markdown and last strategy is used to display the images in the gallery.
Conventional markdown syntax#


Image directive#
```{image} /_static/bar_colors.png
   :align: center
```
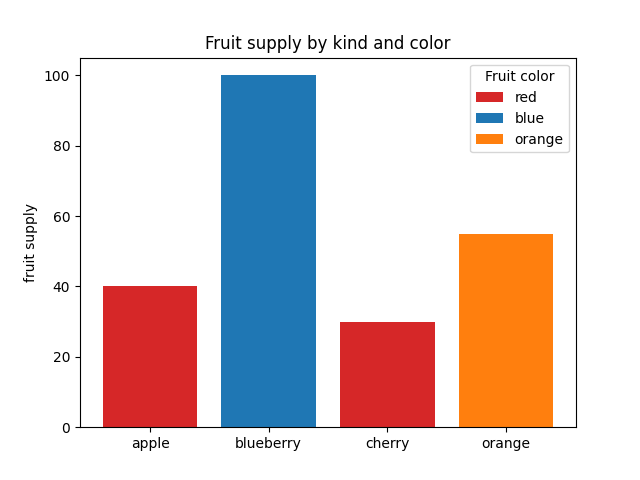
Figure directive#
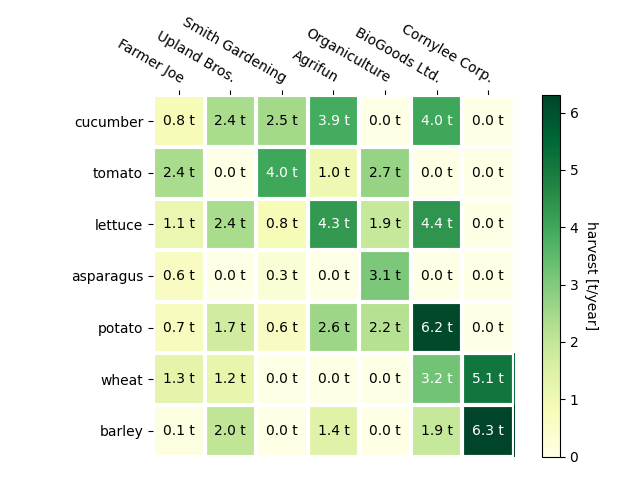
```{figure} /_static/heatmap.png
   :align: center
```
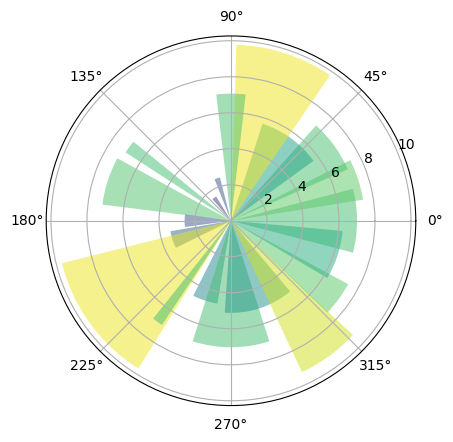
import matplotlib.pyplot as plt
import numpy as np

# Fixing random state for reproducibility
np.random.seed(19680801)

# Compute pie slices
N = 20
theta = np.linspace(0.0, 2 * np.pi, N, endpoint=False)
radii = 10 * np.random.rand(N)
width = np.pi / 4 * np.random.rand(N)
colors = plt.cm.viridis(radii / 10.0)

ax = plt.subplot(projection="polar")
ax.bar(theta, radii, width=width, bottom=0.0, color=colors, alpha=0.5)

plt.show()
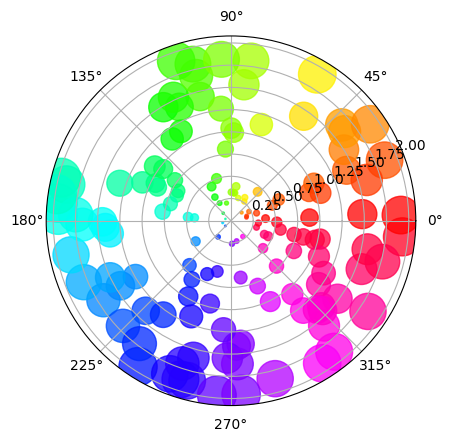
# Fixing random state for reproducibility
np.random.seed(19680801)

# Compute areas and colors
N = 150
r = 2 * np.random.rand(N)
theta = 2 * np.pi * np.random.rand(N)
area = 200 * r**2
colors = theta

fig = plt.figure()
ax = fig.add_subplot(projection="polar")
c = ax.scatter(theta, r, c=colors, s=area, cmap="hsv", alpha=0.75)